Analytics
Measure → Analytics shows your published posts and how they did. Numbers are fetched from each network once a day.
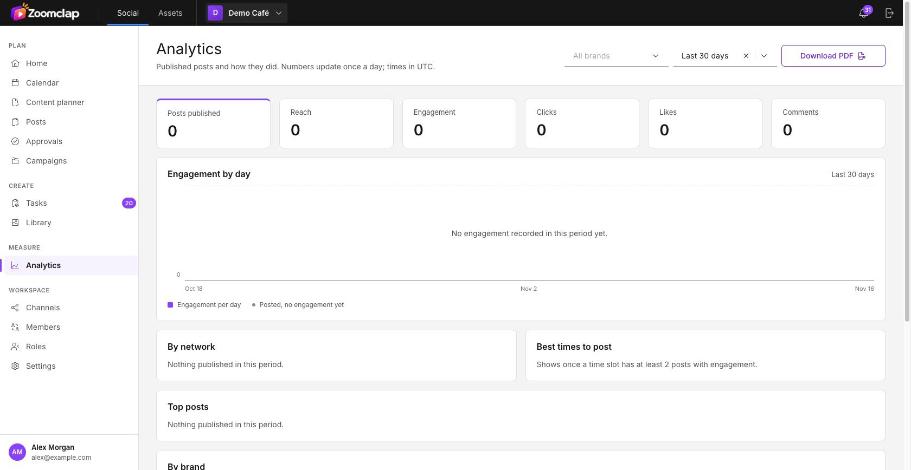
What's on the page
| Section | Shows |
|---|---|
| Totals | Posts published, reach, engagement, clicks, likes and comments |
| Engagement by day | A chart of engagement across the period |
| By network | How each network did |
| Best times to post | When your posts get the most engagement, by weekday and hour; shown once a time slot has at least 2 posts with engagement |
| Top posts | Your best-performing posts |
| By brand | How each brand did |
| By designer | The posts each designer made and how they performed |
Choose a brand and a period (such as the last 7, 30 or 90 days) at the top. Download PDF saves the page as a report.
Report emails
Schedule report emails from Settings → Reports.